6 Streaming Analytics
6.1 Introduction
In this chapter, we explore whether age group influences people’s preferred streaming platform. Specifically, we examine whether certain platforms (Netflix, Hulu, Disney+, or Amazon) appeal more to specific age demographics. Using simulated survey data, we conducted analyses including descriptive statistics, data visualization, and a chi-square test of independence. We also calculated Cramer’s V to assess the strength of the relationship between age group and platform preference, and identified which specific age–platform combinations contribute most to any significant differences.
6.3 Data Preparation
6.3.1 Load and Setup Data
platform_age_preference <- read_excel("Streaming Services and Age.xlsx")
summary(platform_age_preference)
## AgeCat Platform
## Length:300 Length:300
## Class :character Class :character
## Mode :character Mode :character## tibble [300 × 2] (S3: tbl_df/tbl/data.frame)
## $ AgeCat : chr [1:300] "18–25" "18–25" "18–25" "18–25" ...
## $ Platform: chr [1:300] "Other" "Hulu" "Netflix" "Netflix" ...6.3.3 Contingency Table: Streaming Platform
##
##  Amazon Disney+    Hulu Netflix   Other
## 54 61 46 111 286.4 Visualization
6.4.1 Stacked Bar Chart: Platform Preference Within Each Age Group
stacked_graph <- ggplot(platform_age_preference, aes(x = AgeCat, fill = Platform)) +
geom_bar(position = "fill") +
labs(
title = "Platform Preference Within Each Age Group",
x = "Age Group",
y = "Proportion",
fill = "Platform") +
theme_fivethirtyeight()
stacked_graph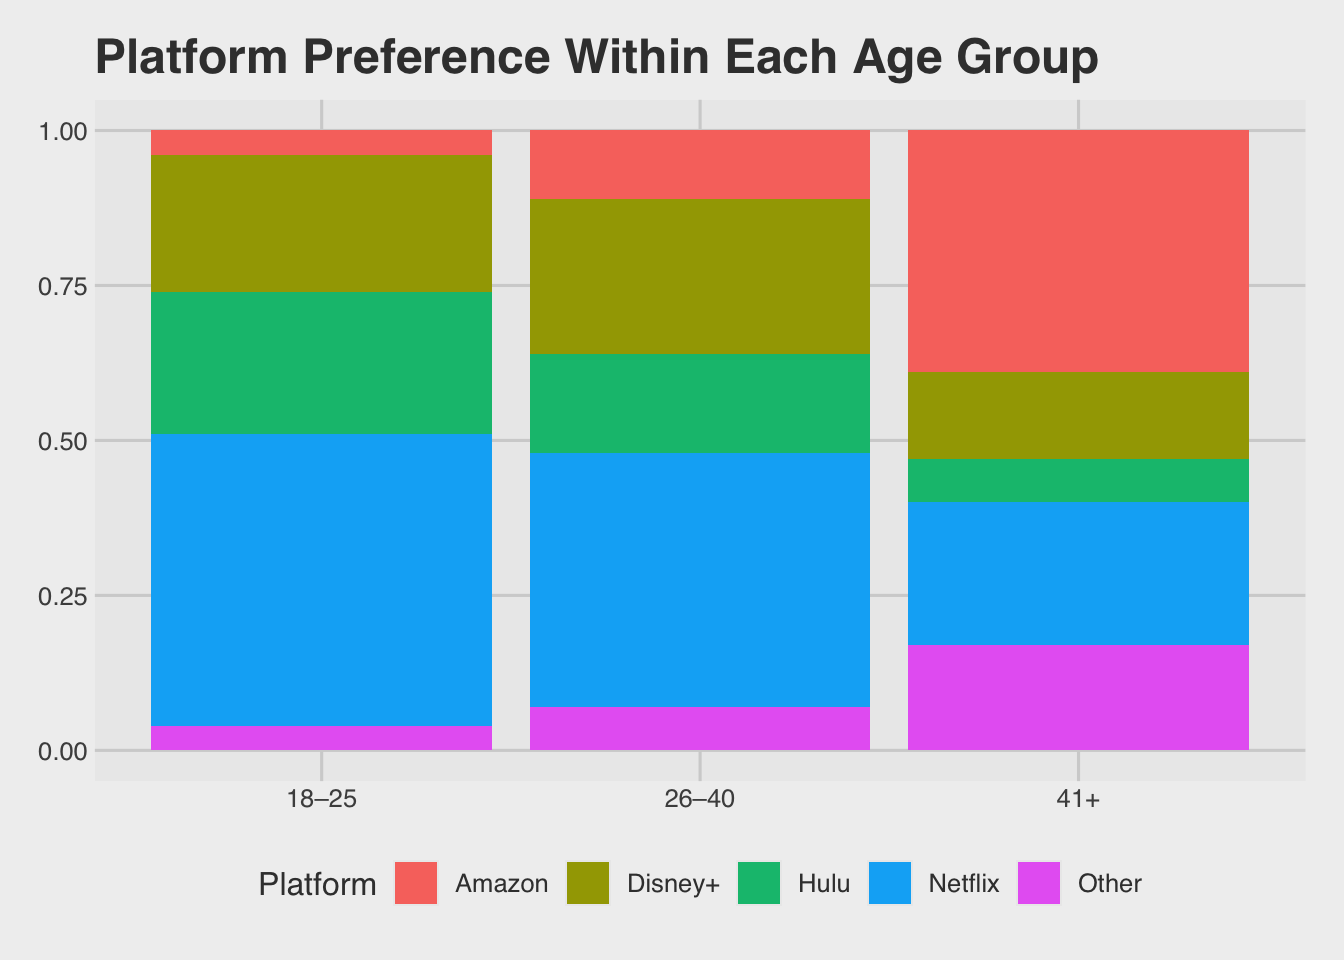
(#fig:stacked bar)Stacked bar chart showing the proportion of streaming platform preferences within each age group. Each bar represents an age group, with segments indicating the relative share of preferences for each platform.
6.4.1.1 Interpretation:
The stacked bar chart shows the proportion of streaming platform preferences within each age group. We can see that Netflix is the most popular platform among people aged 18–25 and 26–40. However, as age increases, preferences begin to shift. For adults aged 41 and older, Amazon becomes the most preferred platform instead of Netflix.
6.4.2 Clustered Bar Chart: Platform Preference Counts by Age Groups
clustered_graph<- ggplot(platform_age_preference, aes(x= AgeCat, fill = Platform)) +
geom_bar(position = "dodge") +
labs(
title="Platform Preference Counts by Age Groups",
x = "Age Group",
y = "Counts",
fill = "Platform") +
theme_fivethirtyeight()
clustered_graph 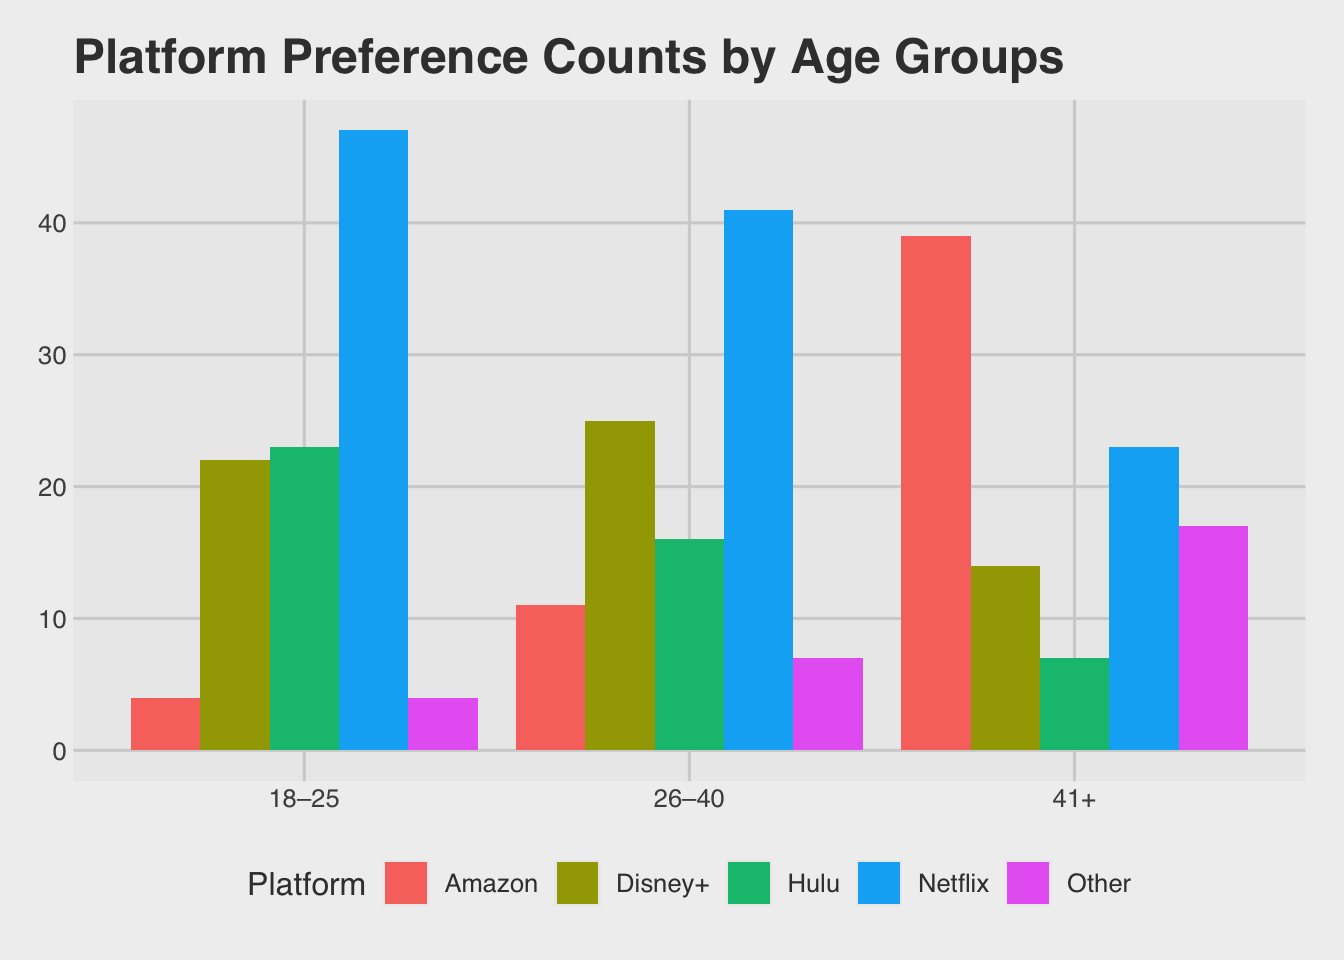
(#fig:clustered bar)Clustered bar chart showing the number of respondents preferring each streaming platform across age groups. Bars within each age group represent counts for each platform, allowing for direct comparison of platform popularity by age category.
6.4.2.1 Interpretation:
The clustered bar chart shows the number of people in each age group who prefer each streaming platform. We can see that Netflix has the highest number of users in the 18–25 and 26–40 age groups. Again, for adults aged 41 and older, Amazon becomes the most preferred platform, replacing Netflix as the leading choice.
6.5 Chi-Square Test of Independence
##
## Pearson's Chi-squared test
##
## data: table_total
## X-squared = 68.044, df = 8, p-value = 1.203e-116.6 Observed, Expected, and Residual Values
6.6.1 Observed Values
##
##         Amazon Disney+ Hulu Netflix Other
##   18–25      4      22   23      47     4
##   26–40     11      25   16      41     7
## 41+ 39 14 7 23 176.6.2 Expected Values
##
##         Amazon  Disney+     Hulu Netflix    Other
##   18–25     18 20.33333 15.33333      37 9.333333
##   26–40     18 20.33333 15.33333      37 9.333333
##   41+       18 20.33333 15.33333      37 9.333333
6.6.3 Residual Values
##
##             Amazon    Disney+       Hulu    Netflix      Other
##   18–25 -3.2998316  0.3696106  1.9578900  1.6439899 -1.7457431
##   26–40 -1.6499158  1.0349098  0.1702513  0.6575959 -0.7637626
##   41+    4.9497475 -1.4045204 -2.1281413 -2.3015858  2.5095057
6.6.3.1 Interpretation:
After running a chi-square test, we looked more closely at the observed, expected, and residual values. Residuals show how different the observed values are from the expected values. The largest positive residual (more people than expected) was for adults aged 41+ choosing Amazon (39 observed vs. 18 expected). Older adults also chose “Other” platforms more than expected (17 observed vs. 9.33 expected). In contrast, the largest negative residual (fewer people than expected) was for the 18–25 age group choosing Amazon. Only 4 people chose Amazon in this group, even though about 18 were expected (residual = -3.30).
6.7 Contributions to the Chi-Square Statistic
6.7.1 Cell Contributions
cell_contributions <- round((((chi_total$observed - chi_total$expected)^2) / chi_total$expected),2)
contributions_function <- function(x){
  cell_contributions<- round((((x$observed - x$expected)^2) / x$expected),2)
  cell_contributions
}
contributions_total <- contributions_function(chi_total)
contributions_total
##
## Amazon Disney+ Hulu Netflix Other
## 18–25 10.89 0.14 3.83 2.70 3.05
## 26–40 2.72 1.07 0.03 0.43 0.58
## 41+ 24.50 1.97 4.53 5.30 6.306.7.2 Percent Contributions
percent_contributions <- round((cell_contributions / chi_total$statistic) * 100, 2)

percent_contributions_function<- function(x){
  cell_contributions<-round((((x$observed - x$expected)^2) / x$expected),2)

  percent_contributions<- round((cell_contributions / x$statistic) * 100, 2)
  percent_contributions
}

total_percent <- percent_contributions_function(chi_total)
total_percent
##
## Amazon Disney+ Hulu Netflix Other
## 18–25 16.00 0.21 5.63 3.97 4.48
## 26–40 4.00 1.57 0.04 0.63 0.85
## 41+ 36.01 2.90 6.66 7.79 9.266.7.3 Heatmap of Percentage Contributions by Age Group and Streaming Platform
pheatmap(percent_contributions,
         display_numbers = TRUE,
         cluster_rows = FALSE,
         cluster_cols = FALSE,
         main = "% Contribution to Chi-Square Statistic")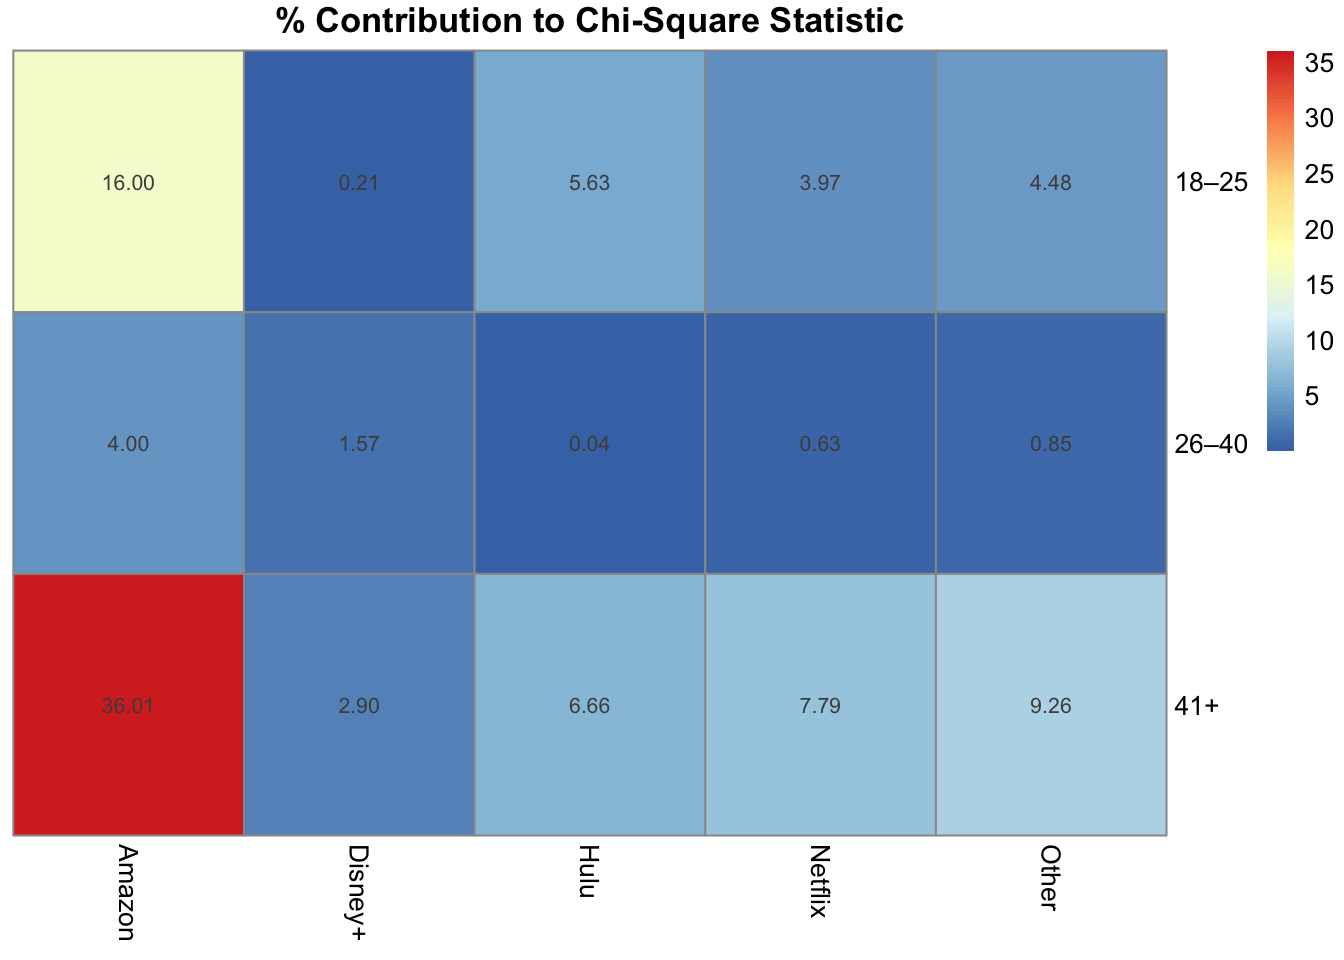
Figure 6.1: Heatmap showing the percentage contribution of each age group–platform combination to the overall chi-square statistic. Cells with higher percentage values (shown in red tones) indicate combinations that contribute more strongly to the observed association between age group and streaming platform preference.
pheatmap_function <- function(x) {
  contributions <- ((x$observed - x$expected)^2) / x$expected
  percent_contributions <- round(((contributions / x$statistic) * 100),2)
  return(percent_contributions)
}

pheat_total<- pheatmap_function(chi_total)
pheat_total
##
## Amazon Disney+ Hulu Netflix Other
## 18–25 16.00 0.20 5.63 3.97 4.48
## 26–40 4.00 1.57 0.04 0.64 0.86
## 41+ 36.01 2.90 6.66 7.79 9.266.7.3.1 Interpretation:
The cell that contributed the most to the overall Chi-Square statistic is the combination of older adults (41+) and Amazon, accounting for about 36% of the total χ² value. This means that viewers aged 41 and older chose Amazon far more often than expected compared to other age groups. In contrast, younger viewers (18–25) contributed a notable portion (16%) of the χ² value through lower-than-expected counts for Amazon, indicating that fewer young adults prefer Amazon than expected.
6.8 Effect Size (Cramer’s V)
## Cramer V
##   0.3368
6.8.0.1 Interpretation:
A Cramer’s V value of 0.34 indicates a moderate association between age category and streaming platform preference. This suggests that age has a noticeable influence on which platform people prefer. Specifically, older and younger viewers tend to show distinct viewing patterns.
6.9 Final Interpretation
The Chi-Square test revealed a significant relationship between age category and streaming platform preference, χ²(8, N = 300) = 68.04, p < .001. The largest contributions came from the 41+/Amazon and 18–25/Amazon combinations, with older adults choosing Amazon far more often than expected, while younger adults chose it far less. Cramer’s V = 0.34 indicates a moderate association, suggesting that age noticeably influences streaming choices. In real-world context, this means that streaming services could benefit from adjusting their marketing and content strategies to better target different age groups, as platform preferences shift with age.